Concrete problems, concrete outcomes

Start with a use case that delivers a clear business outcome.

Each example is structured as problem, solution and expected operational or financial impact.

Energy reporting01

Automate energy monitoring and reporting.

Problem

The Energy Manager pulls data from multiple systems and manually combines it into reports.

SmartTwin

Connects measurements, calculates KPIs and automatically prepares trends and recurring reports.

Result

Less manual work, faster reporting and more time for optimization.

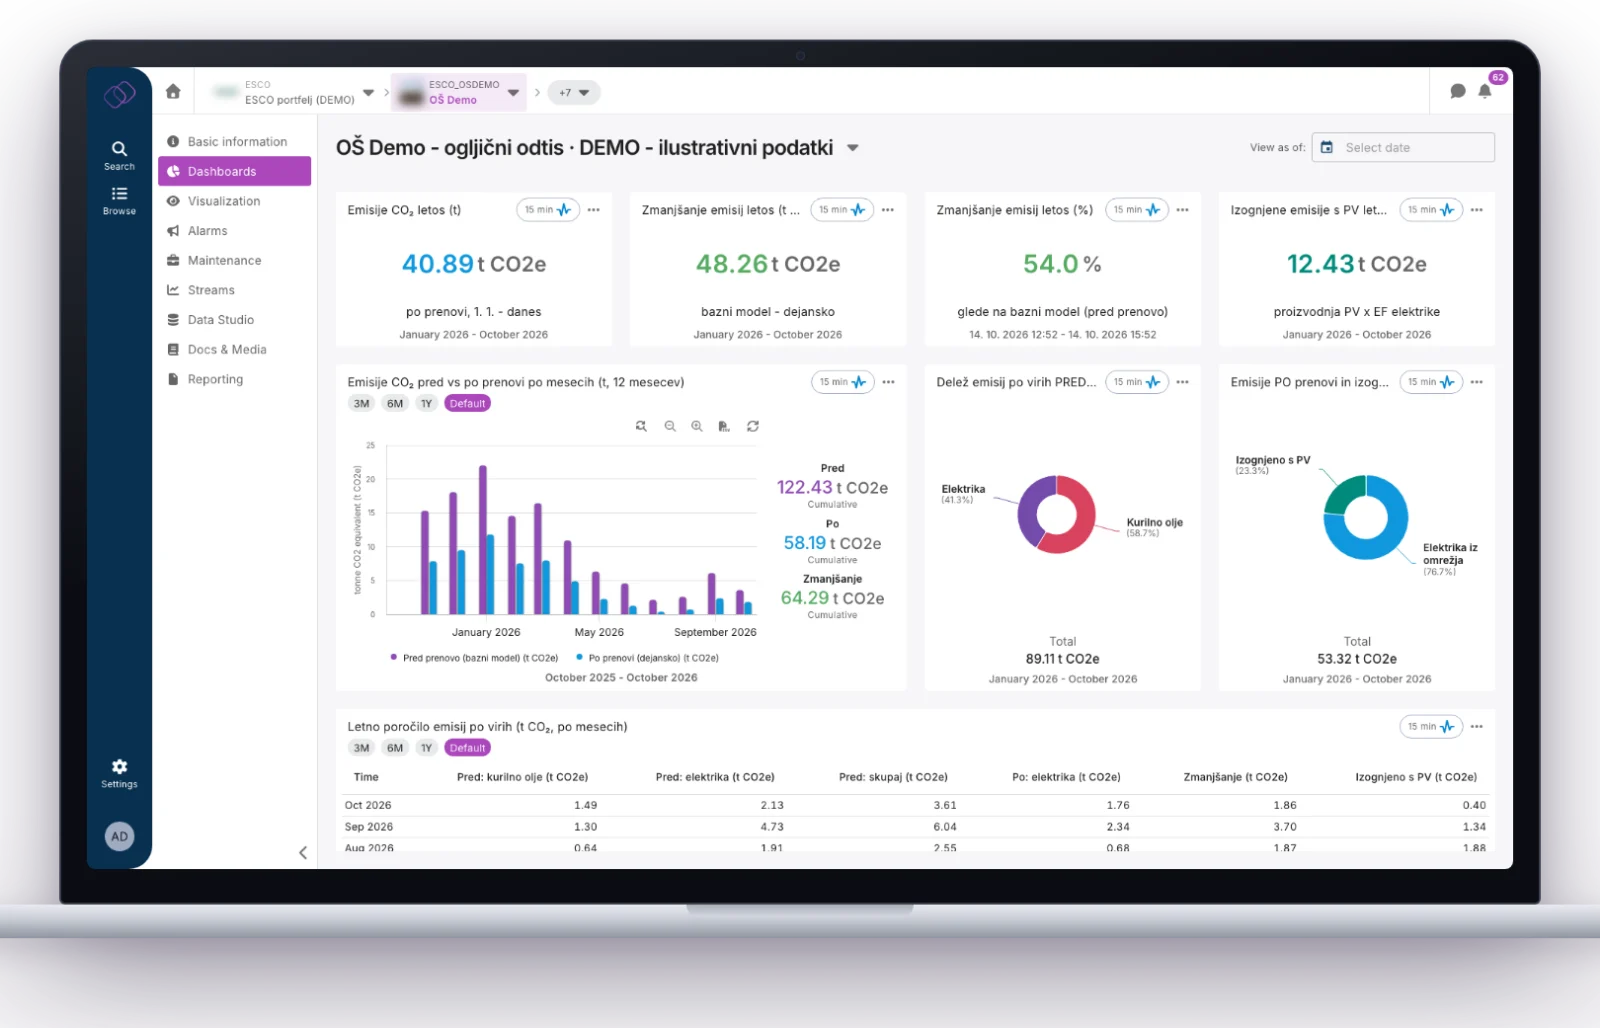
SmartTwin carbon and energy reporting dashboard with monthly emissions before and after renovation and a yearly report table.
Automated monthly emissions and energy report · anonymized demo data
Peak management02

Identify what causes 15-minute demand peaks.

Problem

Power exceeds the desired limit, but it is unclear which loads caused the peak.

SmartTwin

Connects the main meter, submeters, generation, battery and tariff data.

Result

The Energy Manager understands the cause faster and acts before additional costs occur.

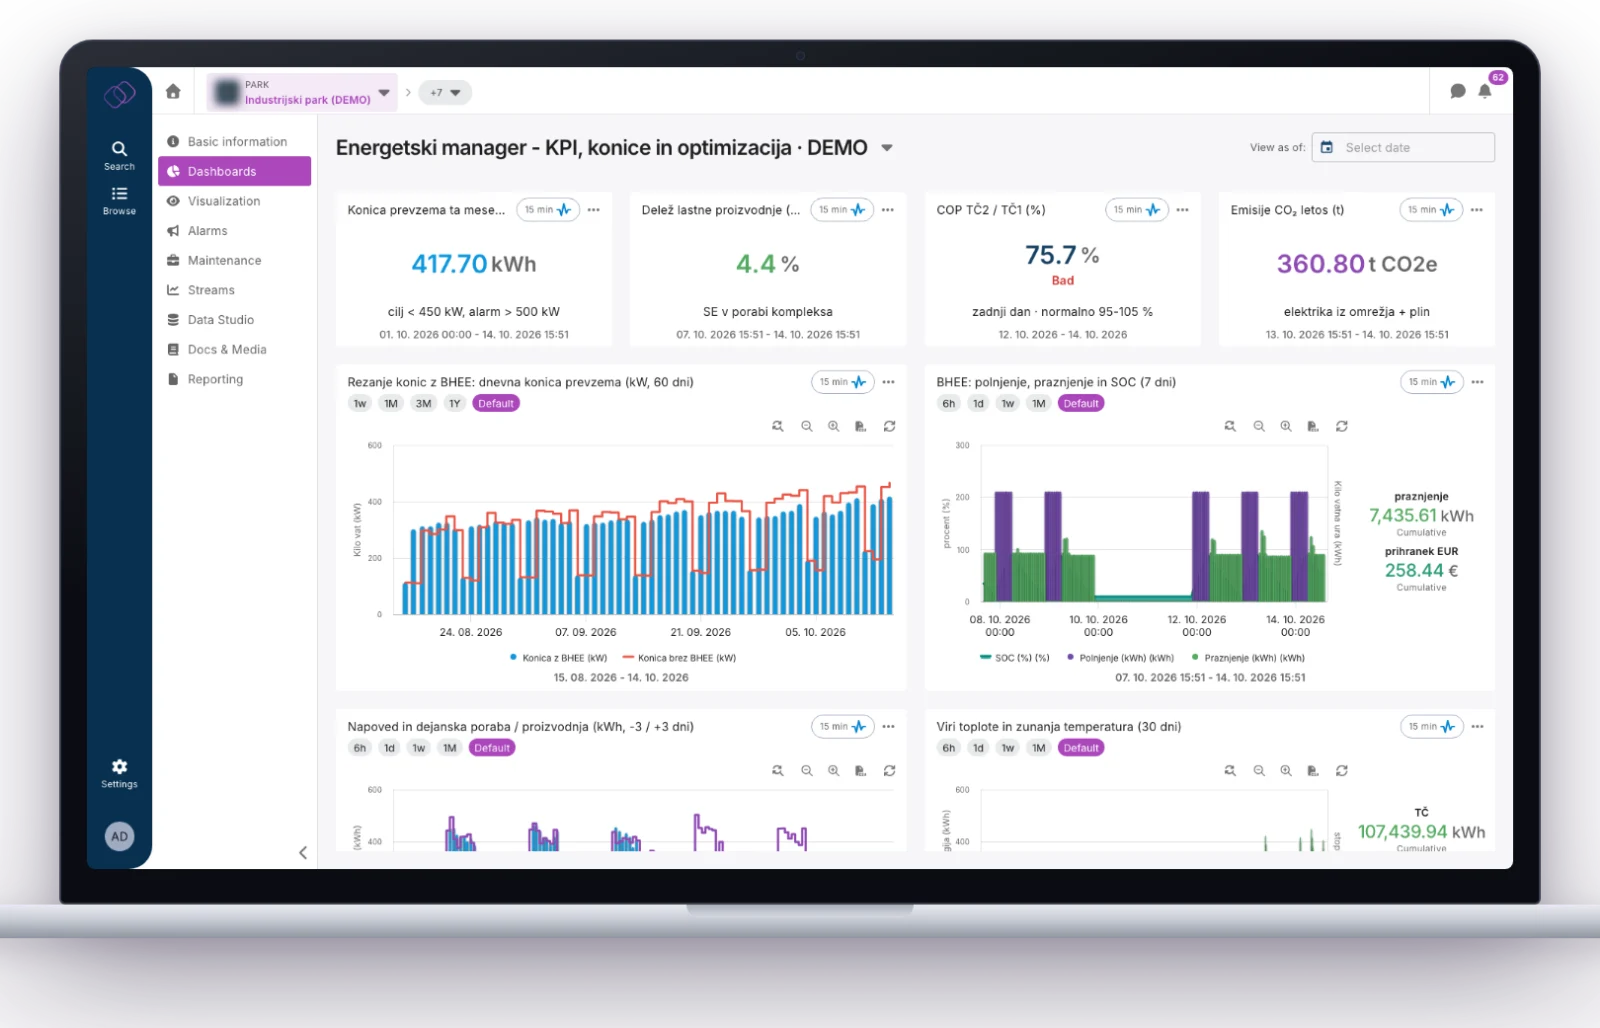
SmartTwin energy manager dashboard with daily demand peaks with and without battery, battery charging and state of charge.
Daily demand peaks with and without battery peak shaving · anonymized demo data
Billing03

Automate utility billing allocation.

Problem

Electricity, water or heat costs must be manually allocated each month across tenants or cost centers.

SmartTwin

Connects measurements, price lists, tariffs, locations, tenants and allocation rules.

Result

Faster billing, fewer errors and transparent cost allocation.

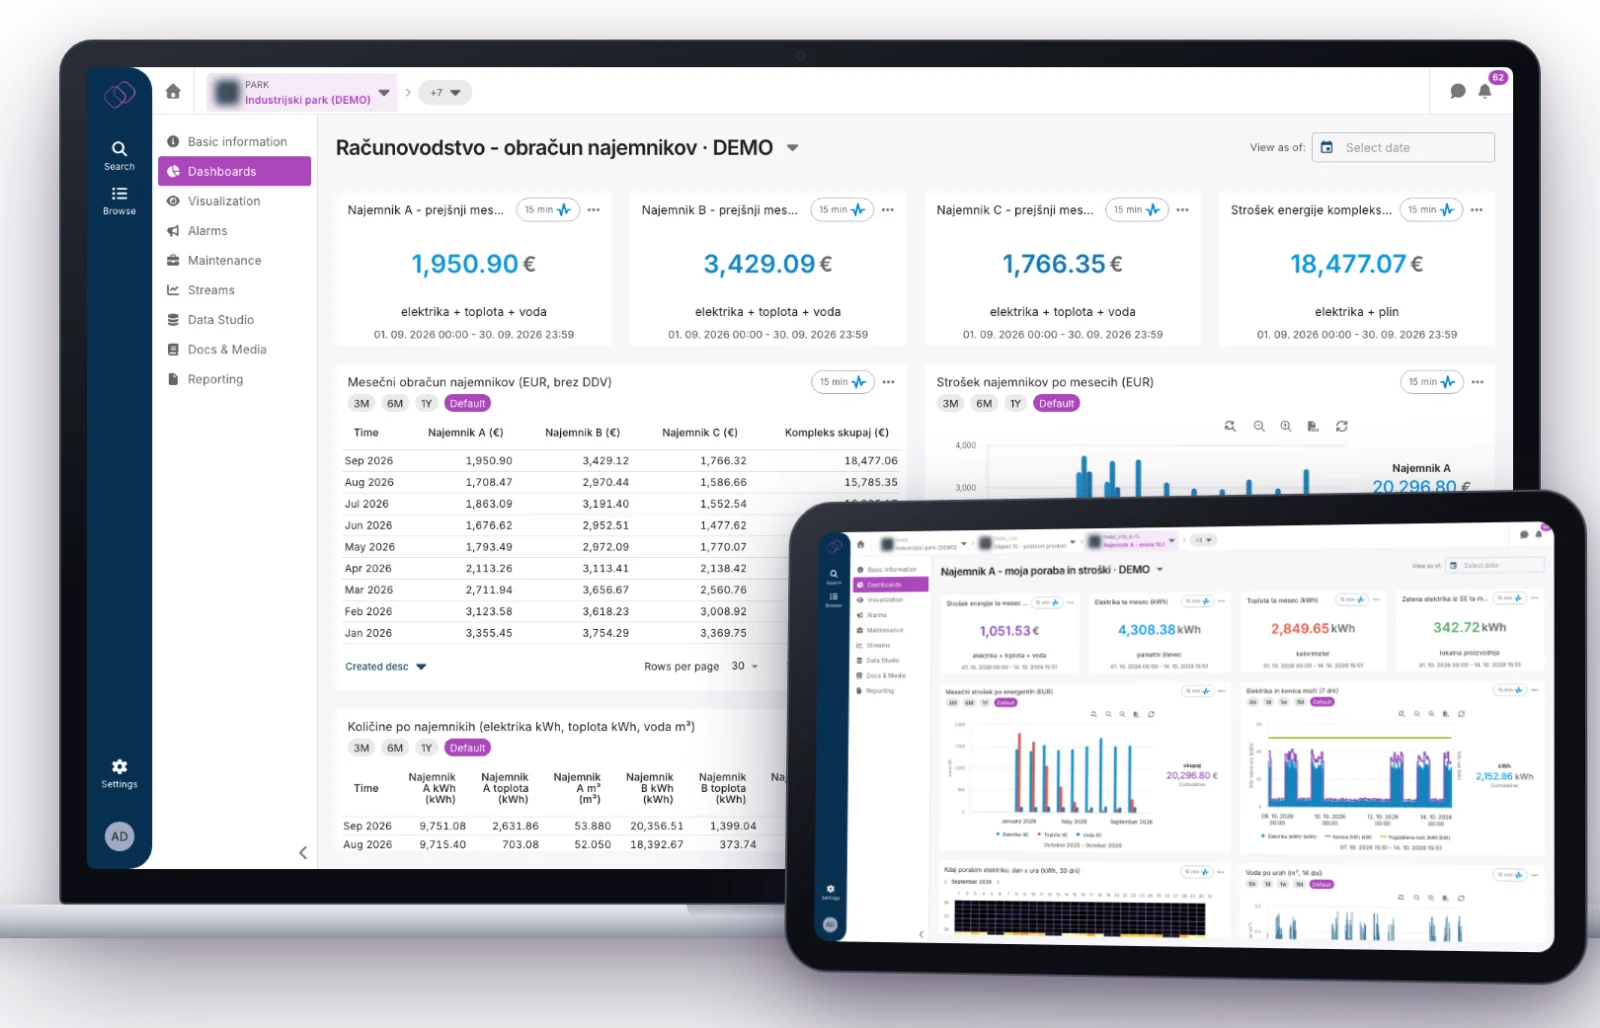
SmartTwin tenant billing dashboard with monthly costs per tenant on a laptop and a tenant self-service view on a tablet.
Monthly tenant billing and a tenant self-service view · anonymized demo data
Condition monitoring04

Monitor the condition of critical assets.

Problem

Maintenance is reactive and the team responds only after an incident occurs.

SmartTwin

Combines asset measurements, alarms, events, maintenance history and documentation.

Result

Faster anomaly detection, better prioritization and shorter response time.

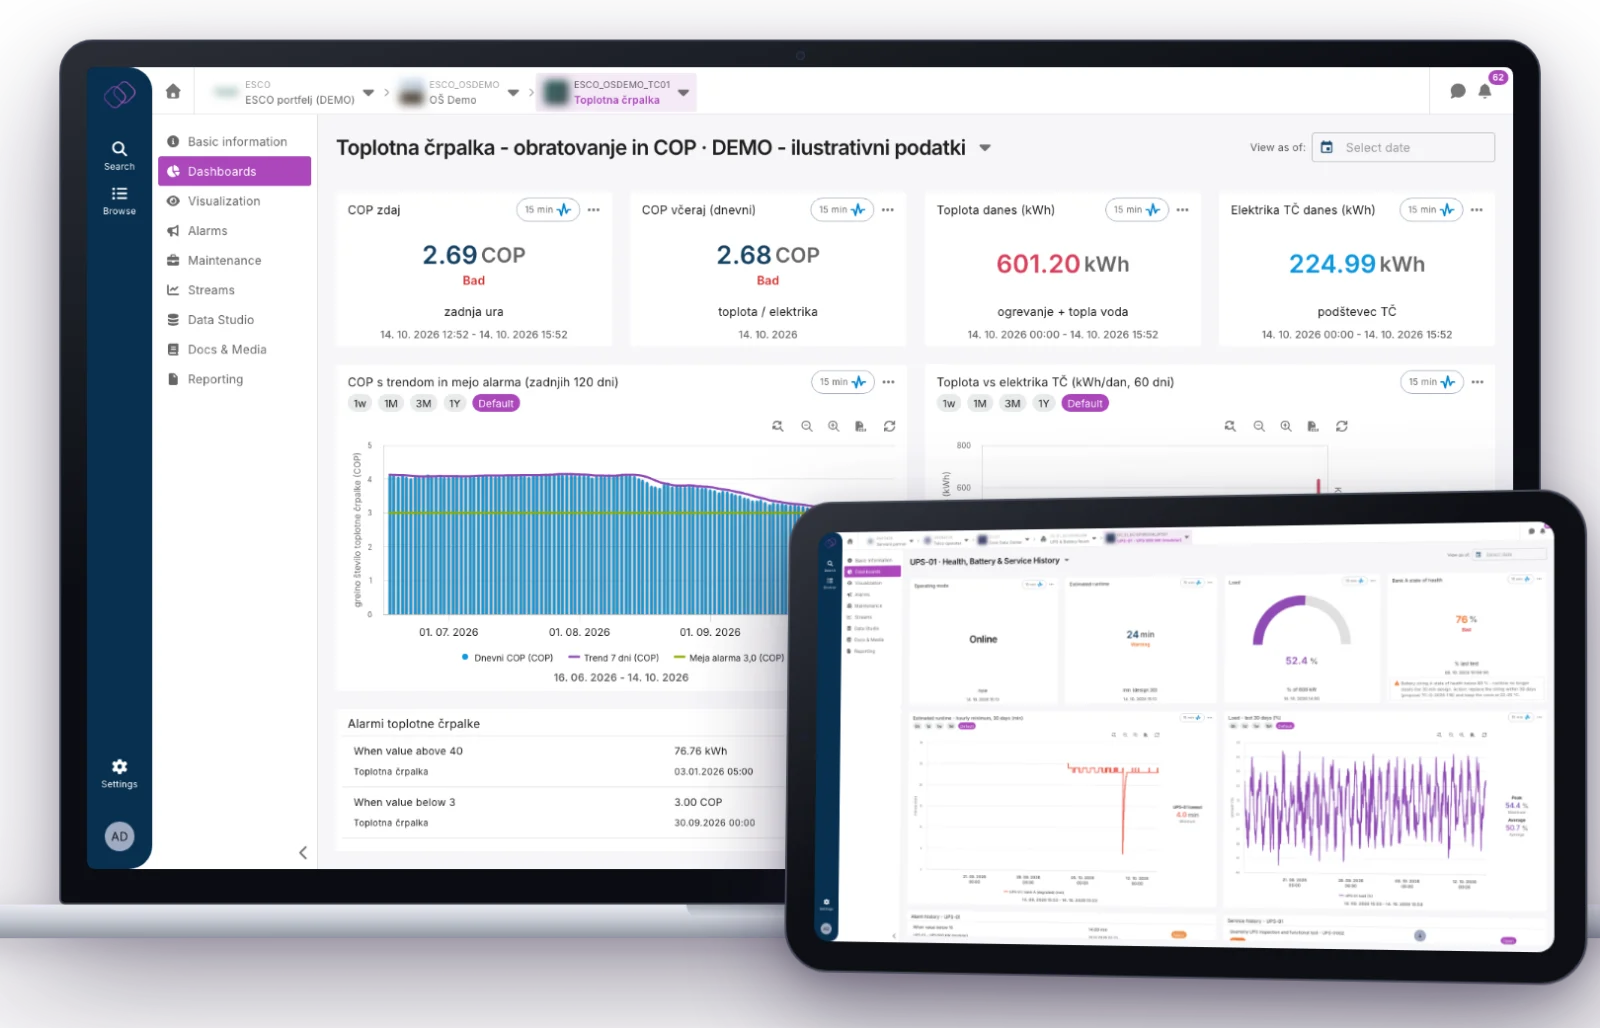
SmartTwin heat pump dashboard with COP trend against alarm limit on a laptop and UPS battery health on a tablet.
Heat pump efficiency trend and UPS battery health · anonymized demo data
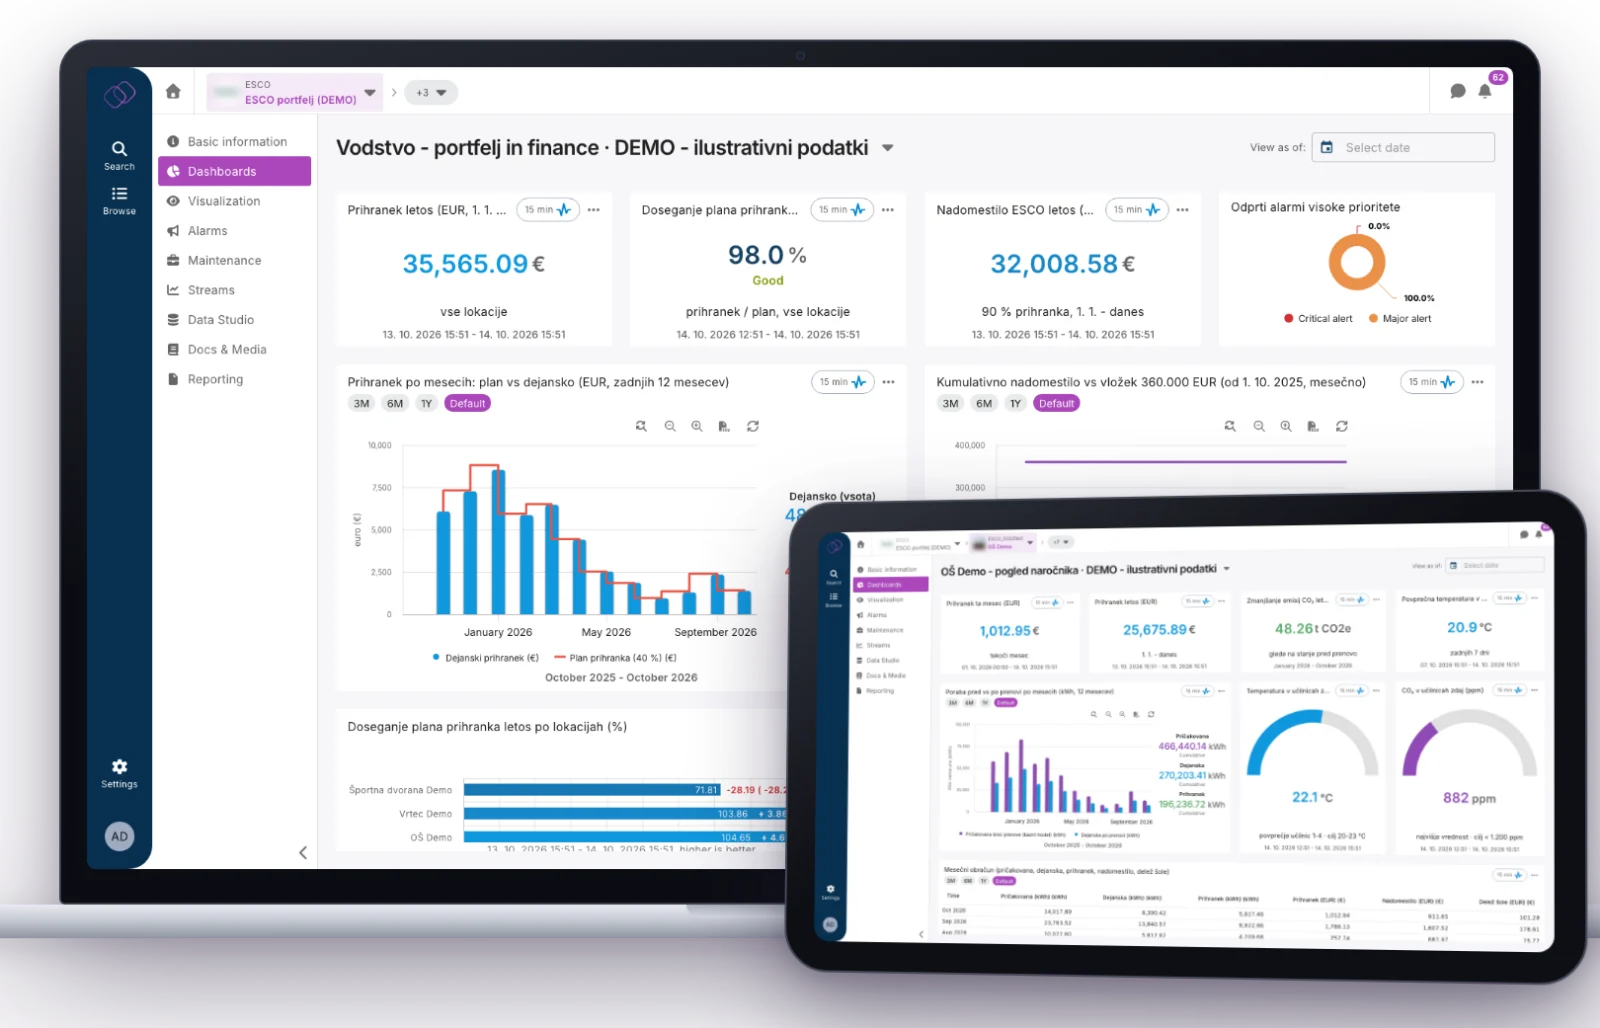
ESCO & energy performance05

Prove energy savings to every party, every month.

Problem

Savings from a renovation or energy performance contract are calculated in spreadsheets, disputed by the client and hard to verify across a portfolio of buildings.

SmartTwin

Compares actual consumption with an agreed baseline model, calculates savings, CO₂ reduction and the contractual compensation split, and gives the ESCO, its technicians and each client their own view.

Result

Transparent monthly M&V reporting, earlier warning when a building drifts from plan, and one shared version of the truth for the contract.

SmartTwin ESCO portfolio dashboard with savings plan versus actual and cumulative compensation on a laptop, and a client view of savings and classroom comfort on a tablet.
ESCO portfolio and client view of savings · anonymized demo data
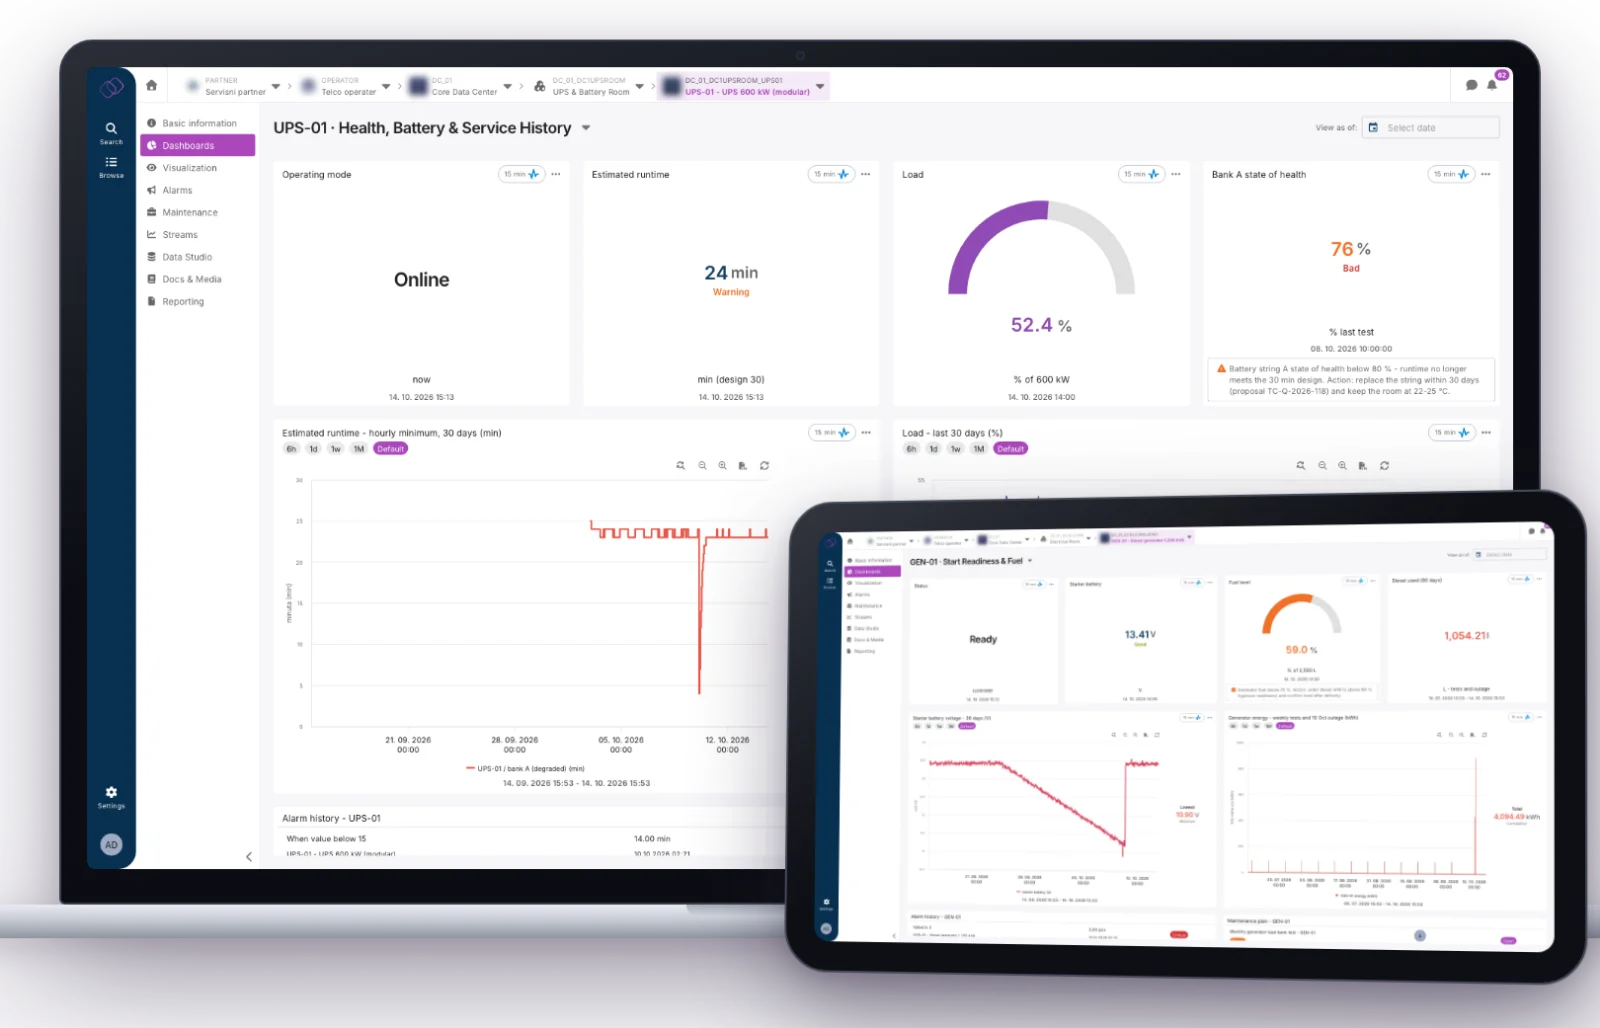
Critical power06

Know that backup power will work before you need it.

Problem

Data centers, telecom sites and hospitals depend on generators, UPS units and batteries that are tested rarely and fail exactly when mains power is lost.

SmartTwin

Monitors the full power chain: mains, ATS, generator readiness and fuel, UPS load, battery health and runtime, and room cooling, with alarms and service tasks for the field team.

Result

Weak batteries, low fuel or a failed start test are visible weeks in advance, and service partners can plan replacements instead of reacting to outages.

SmartTwin UPS health dashboard with operating mode, runtime, load and battery state of health on a laptop, and generator start readiness and fuel on a tablet.
UPS runtime and battery health, generator readiness · anonymized demo data

SmartTwin across industries

Same platform. Different business problem.

Every industry starts from a different question. SmartTwin adapts to its data sources, users and the outcome that matters.

01

Manufacturing

Energy costs, kWh per product, peaks, machine status, downtime and maintenance.

Key question:

Which asset or production line is causing the deviation?

02

Industrial Zones

Consumption by buildings and tenants, utility billing, shared energy systems and infrastructure.

Key question:

How can we automate and audit monthly billing for 30 tenants?

03

Real Estate

Building portfolios, HVAC, costs, documentation, incidents, maintenance and ESG data.

Key question:

Which building deviates most from expected consumption, and why?

04

ESCOs and Integrators

Digital service for monitoring, proving results, reporting and customer support.

Key question:

How can we prove value long-term after implementation?

05

Utility Infrastructure

Central monitoring, alerting, locations, assets, data history and On-Premises deployment.

Key question:

How do we connect distributed infrastructure into one operational view?

06

Carbon Footprint and ESG Reporting

Automated data collection, carbon footprint calculation and ESG reporting without manual data transfer.

Key question:

How can we automate carbon and ESG reporting so it is accurate, comparable and audit-ready?

07

Telecom, Data Centers and Critical Power

Generators, UPS, batteries, cooling, PUE, site alarms and field service across many remote sites.

Key question:

Will backup power and cooling hold at every site during the next outage?

08

Public Buildings and Municipalities

Schools, kindergartens, sports halls and offices, renovation results, comfort, energy contracts and public reporting.

Key question:

Are our renovated buildings delivering the savings we paid for?

09

Agriculture and Research

Herd and field data, laboratory results, quality thresholds and research datasets linked to animals, farms and locations.

Key question:

How do we turn periodic lab and control data into early warnings and research-ready insight?